Final Project Write-Up
Graphically Representing the Mandelbrot Set
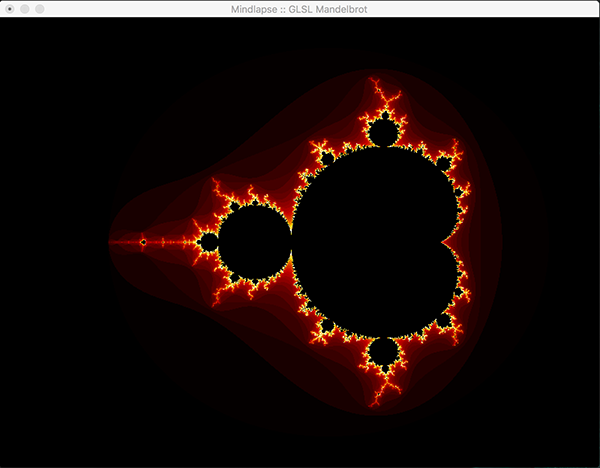
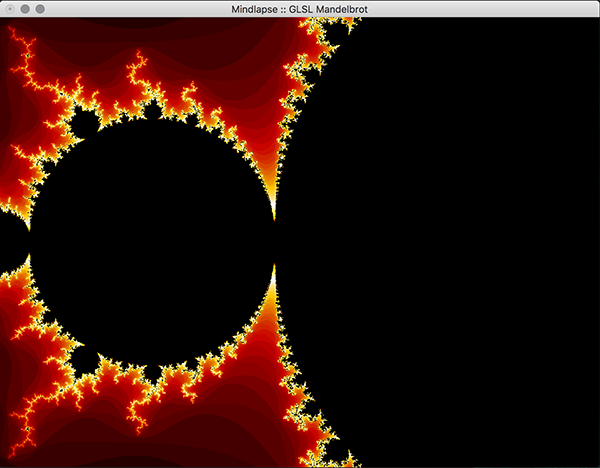
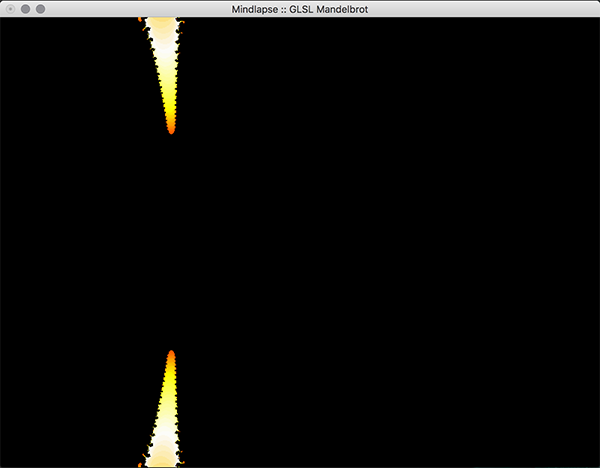
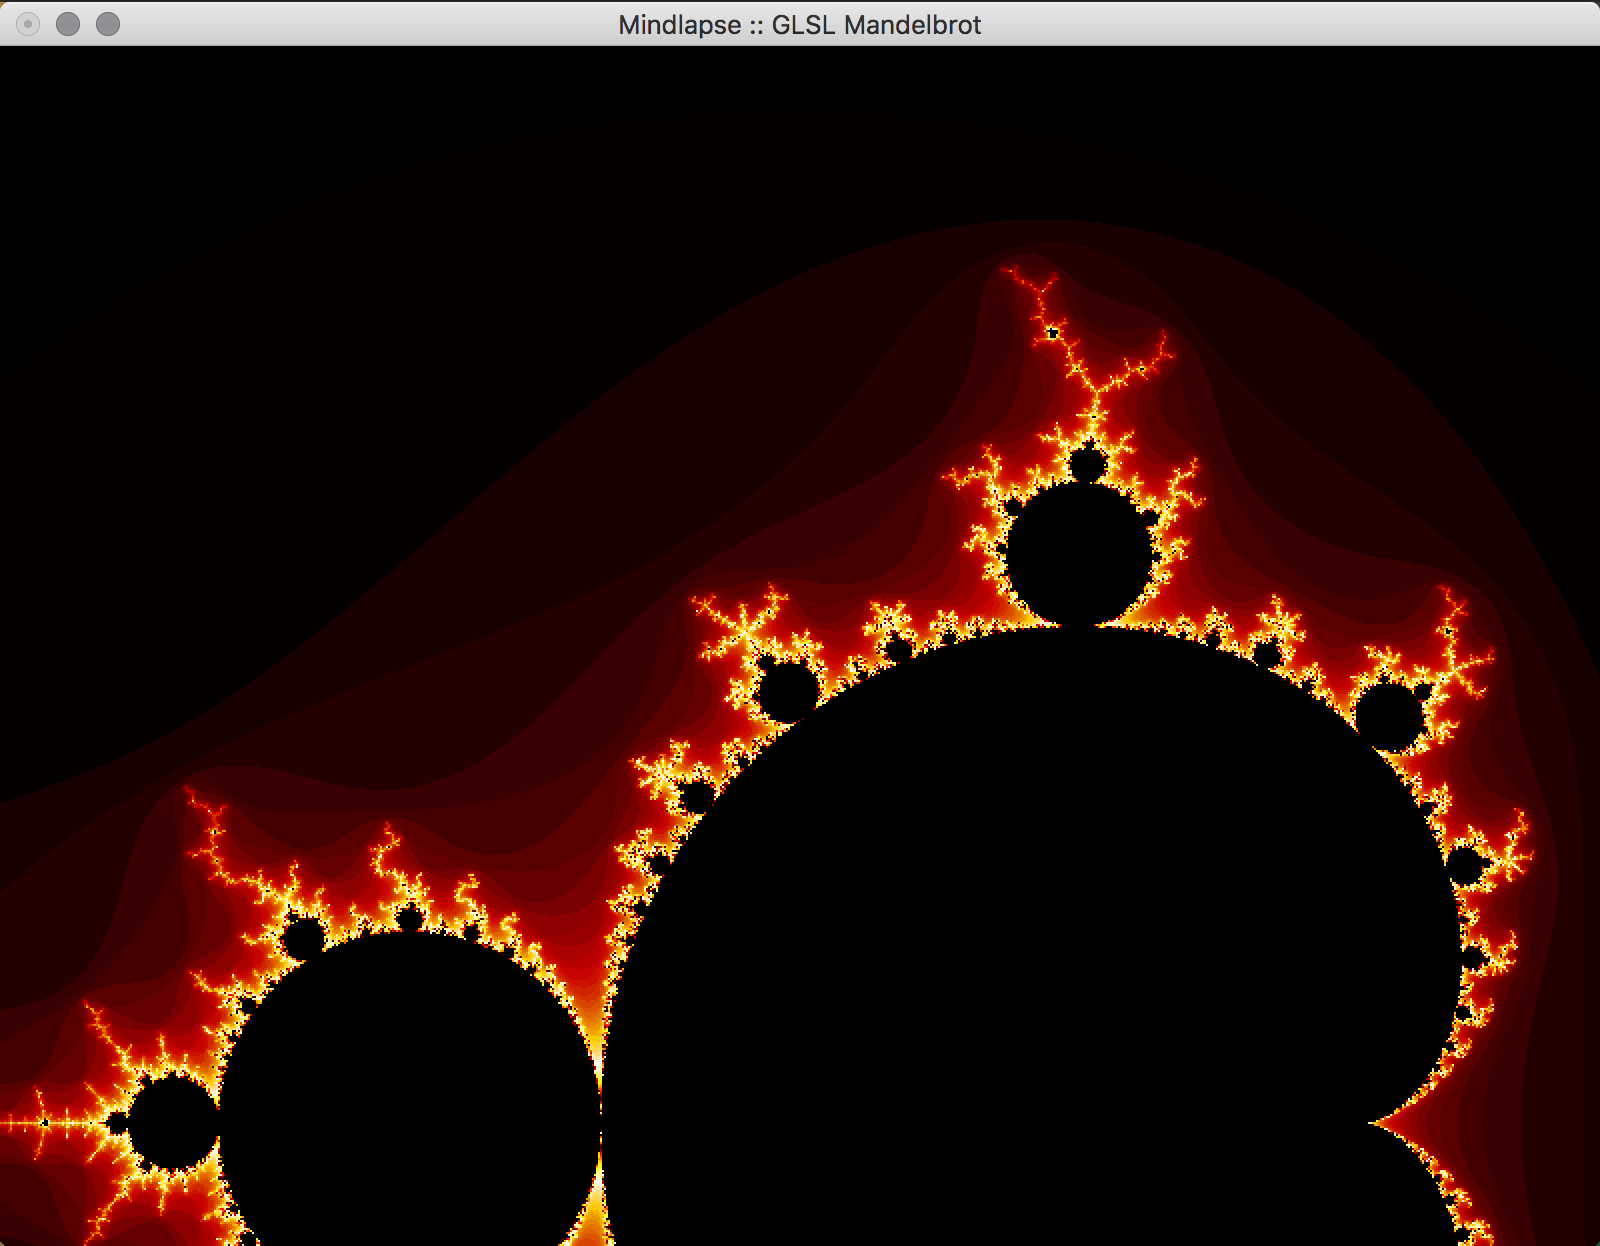
Through this project, we wanted to implement a visual representation of the Mandelbrot Set and how fast values outside of the Mandelbrot set diverge. The Mandelbrot set is a fractal demonstrating whether a complex number a + bi converges when applied as c to the function fc(z) = z2 + c for initial condition z = 0, and recursively plugging in the returned value to fc(z). If at any time the result is greater than 2, the series is guaranteed to not converge. When the complex number converges, it is a member of the Mandelbrot set and, when represented on a 2D plane with real and imaginary axis, is generally colored black. When the complex number does not converge, the rate at which the function diverges is represented by the shading of the coordinate.
We found a simple implementation of the Mandelbrot Set that draws the set, but doesn’t allow for the user to move around the set beyond zooming in on (0,0), so we decided to enhance this implementation by allowing the user to move within the set and allow for natural scrolling instead of their implementation, which took the user’s clicks and drags of the mouse as zoom functionality. We also wanted to reduce the discrete bands of color that appear in the image as well as allow the user to change the colors used in the set. We were able to change the code to accept dragging the mouse as a way to navigate around the set, and zooming into the set at the given coordinates using the keyboard.
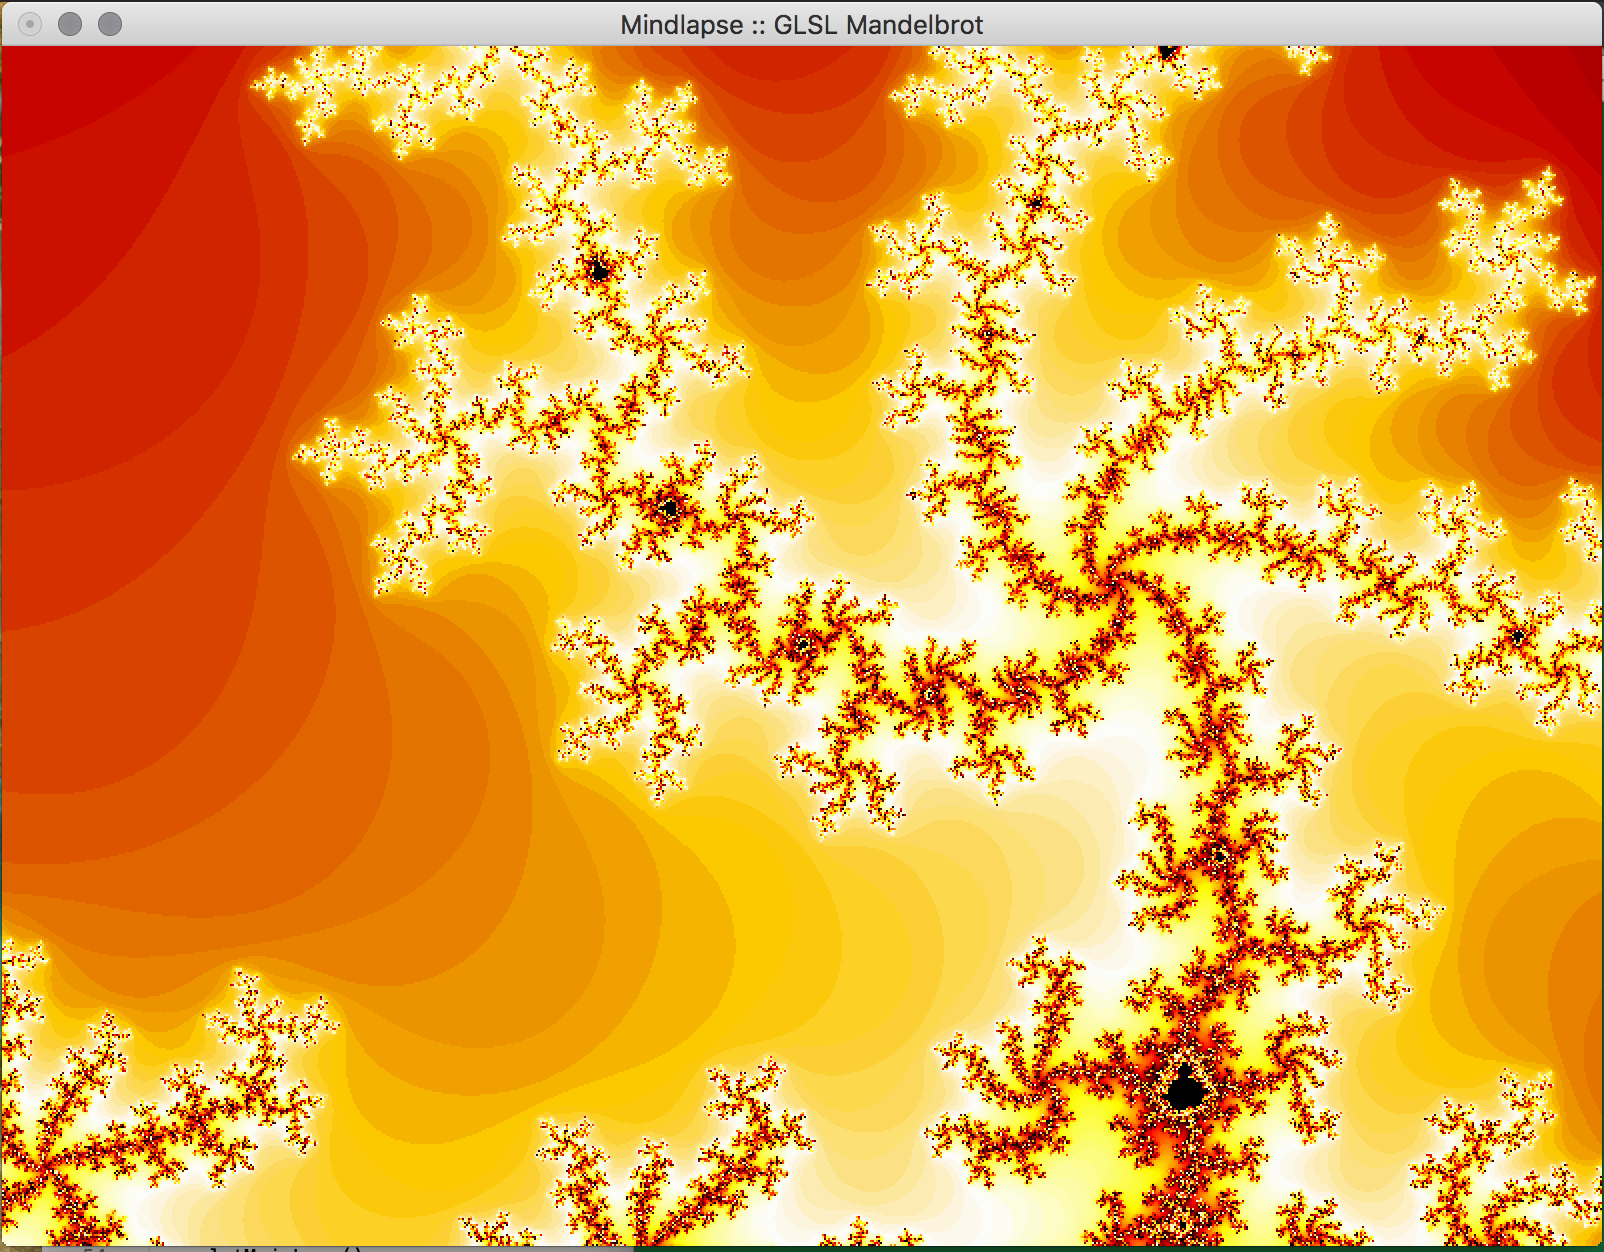
When beginning the project, the largest impediment we faced was that the code easily compiled on a Mac, but after hours of attempting to install and include the necessary libraries, the program would refuse to compile on both Linux and Windows. With this impediment, we were forced to pair program on one computer. We later found that the limitations of the precision of floats limits the ability of OpenGL to zoom past a certain point, whereat the image becomes pixelated.
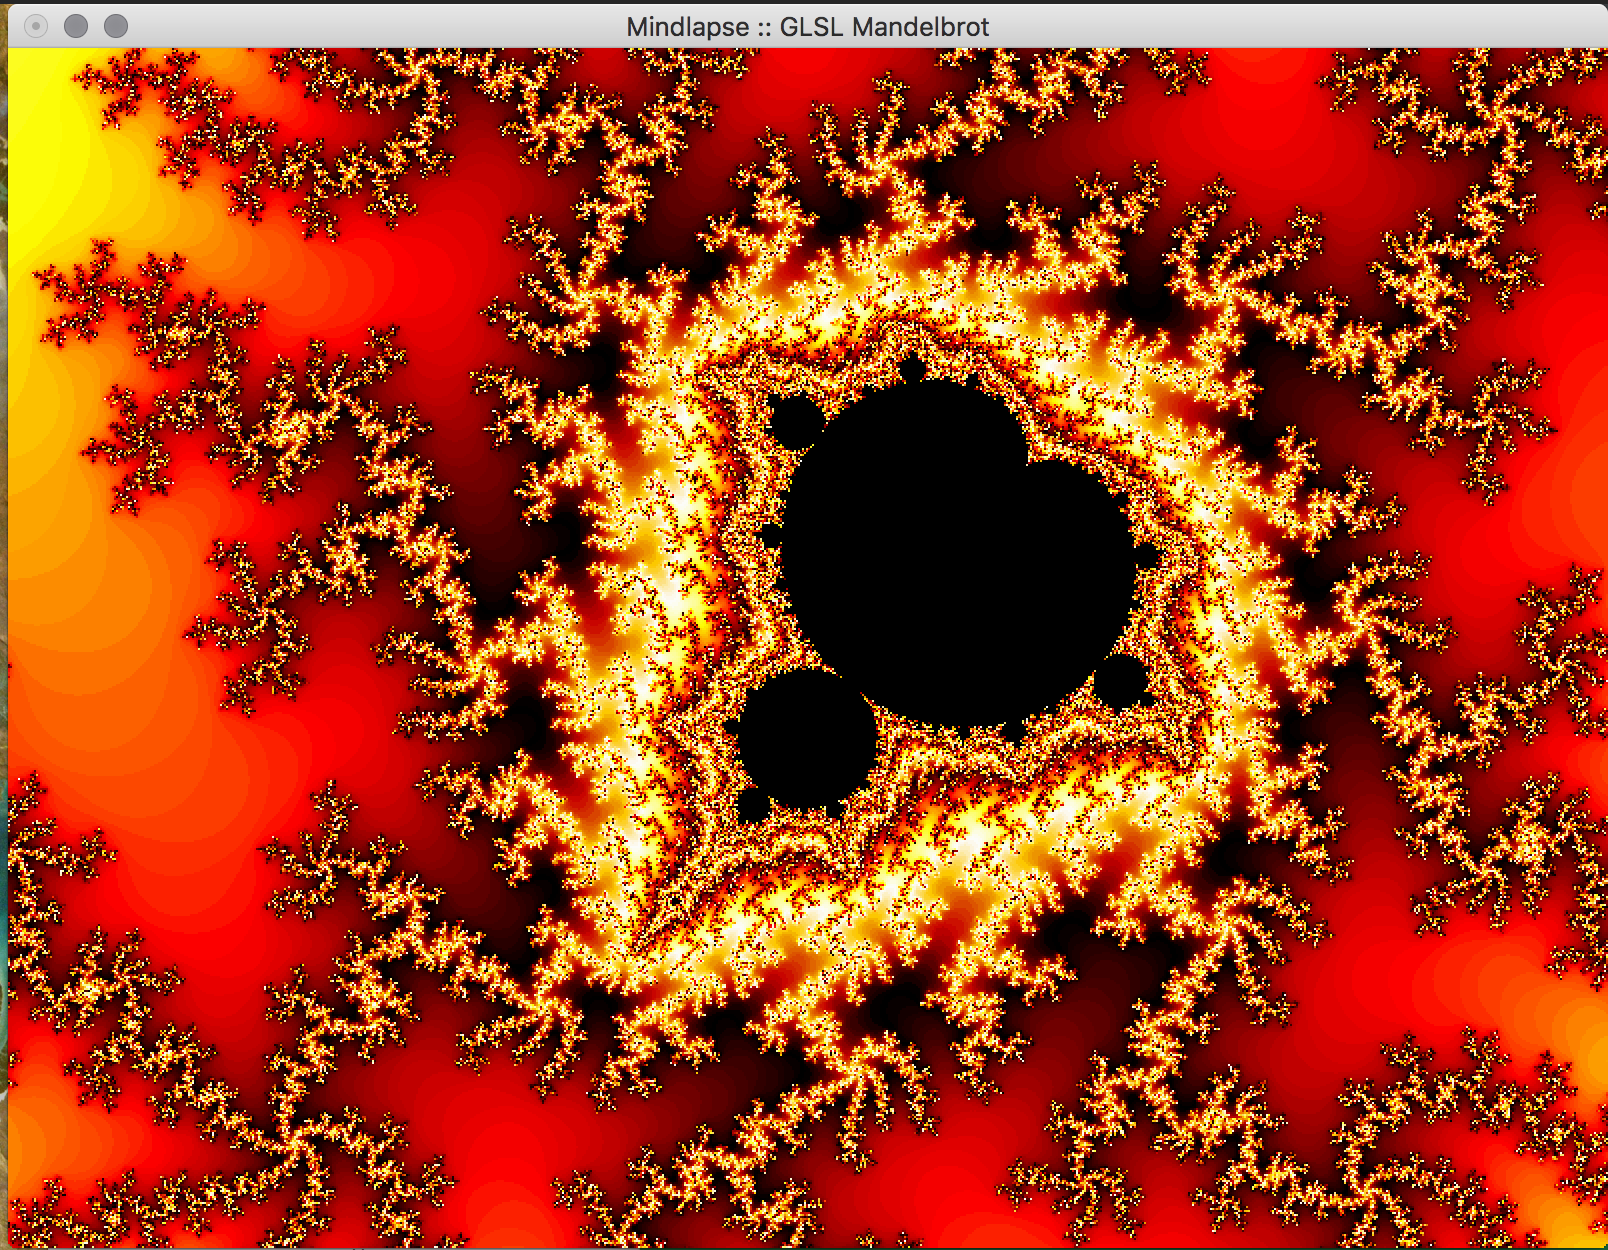
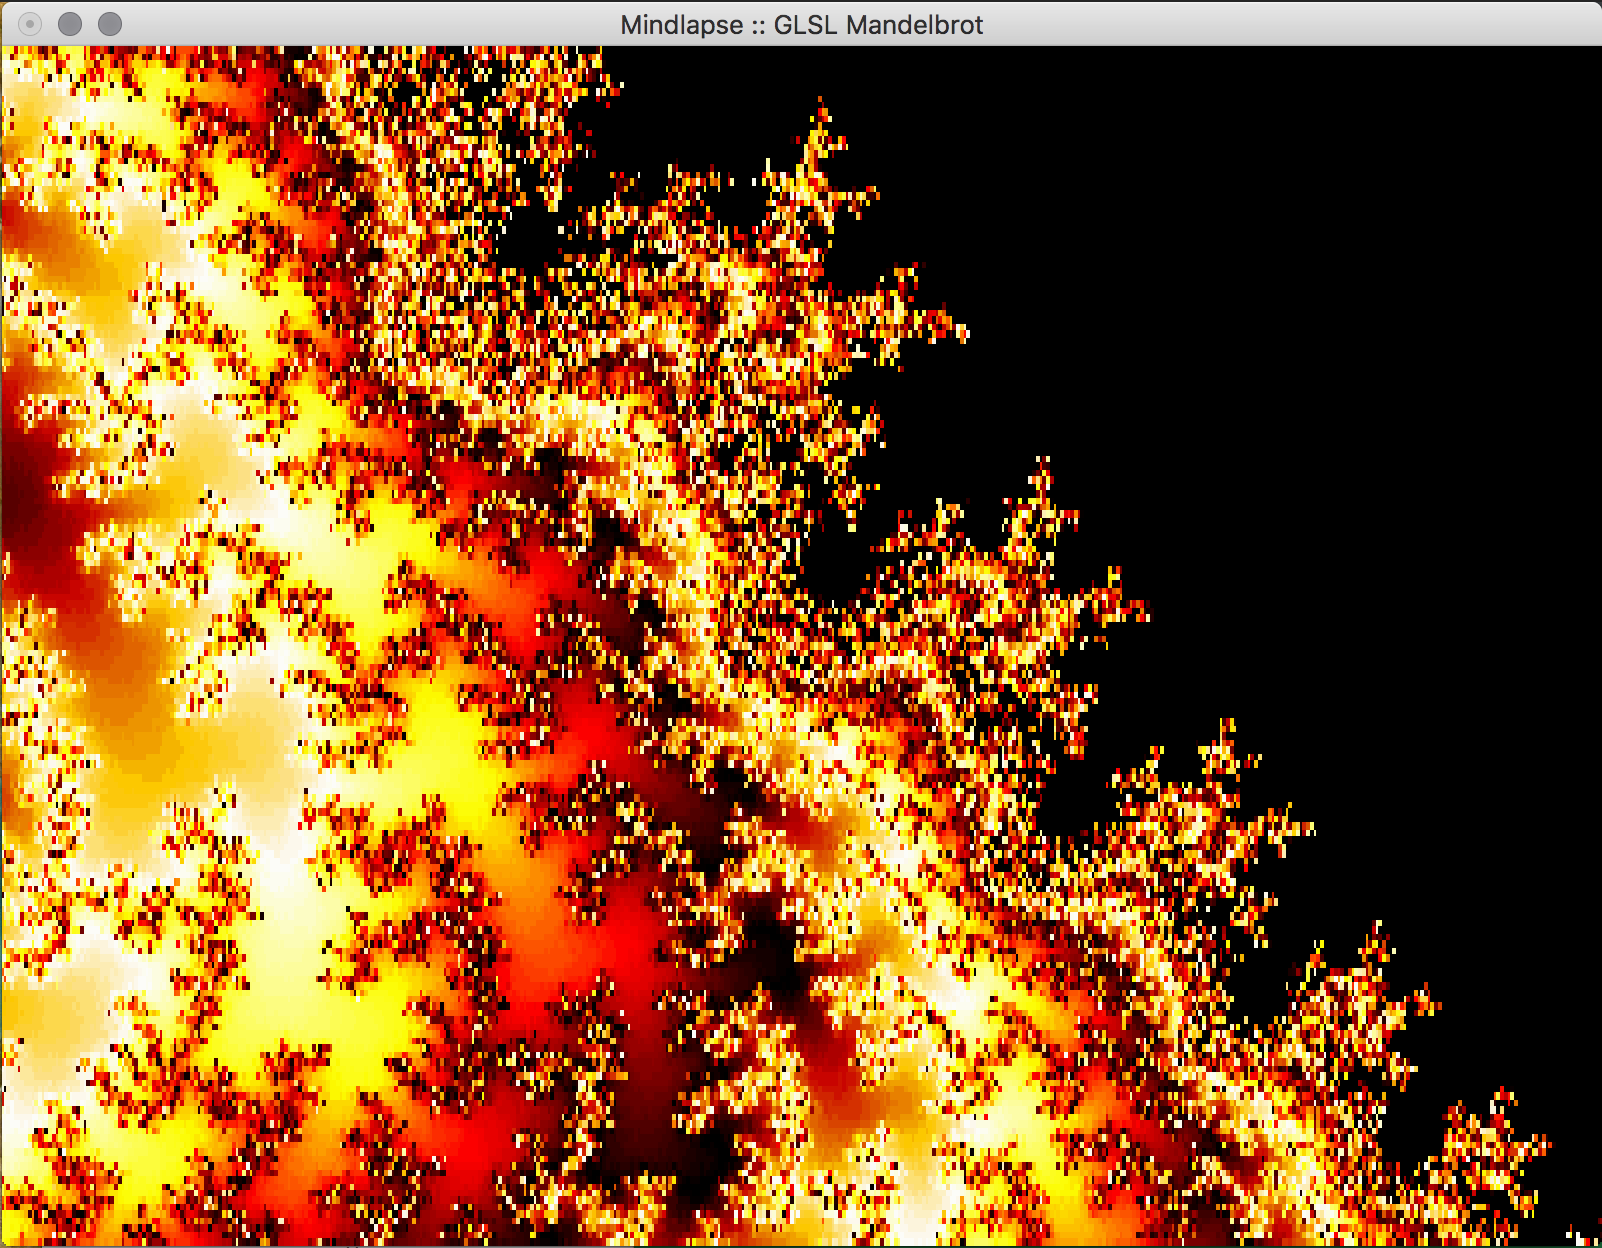
- Connection to class: While this is a 2D image, we still use parts of OpenGL: most importantly the fragment shader. The fragment shader colors each pixel of the image based on the ppm file which maps how fast the complex points diverge or converge. In order to zoom or move the Mandelbrot set, the window must be redrawn as separate frames (similar to animating a window). Also, the banding that appears in the rendering is due to quantizing of the colors used to represent how fast the complex points diverge. Typically this value is stored as an integer, to limit these "bands" we could normalize this information as a float (there is a proposed technique to use logarithms), but we did not have time to implement this.
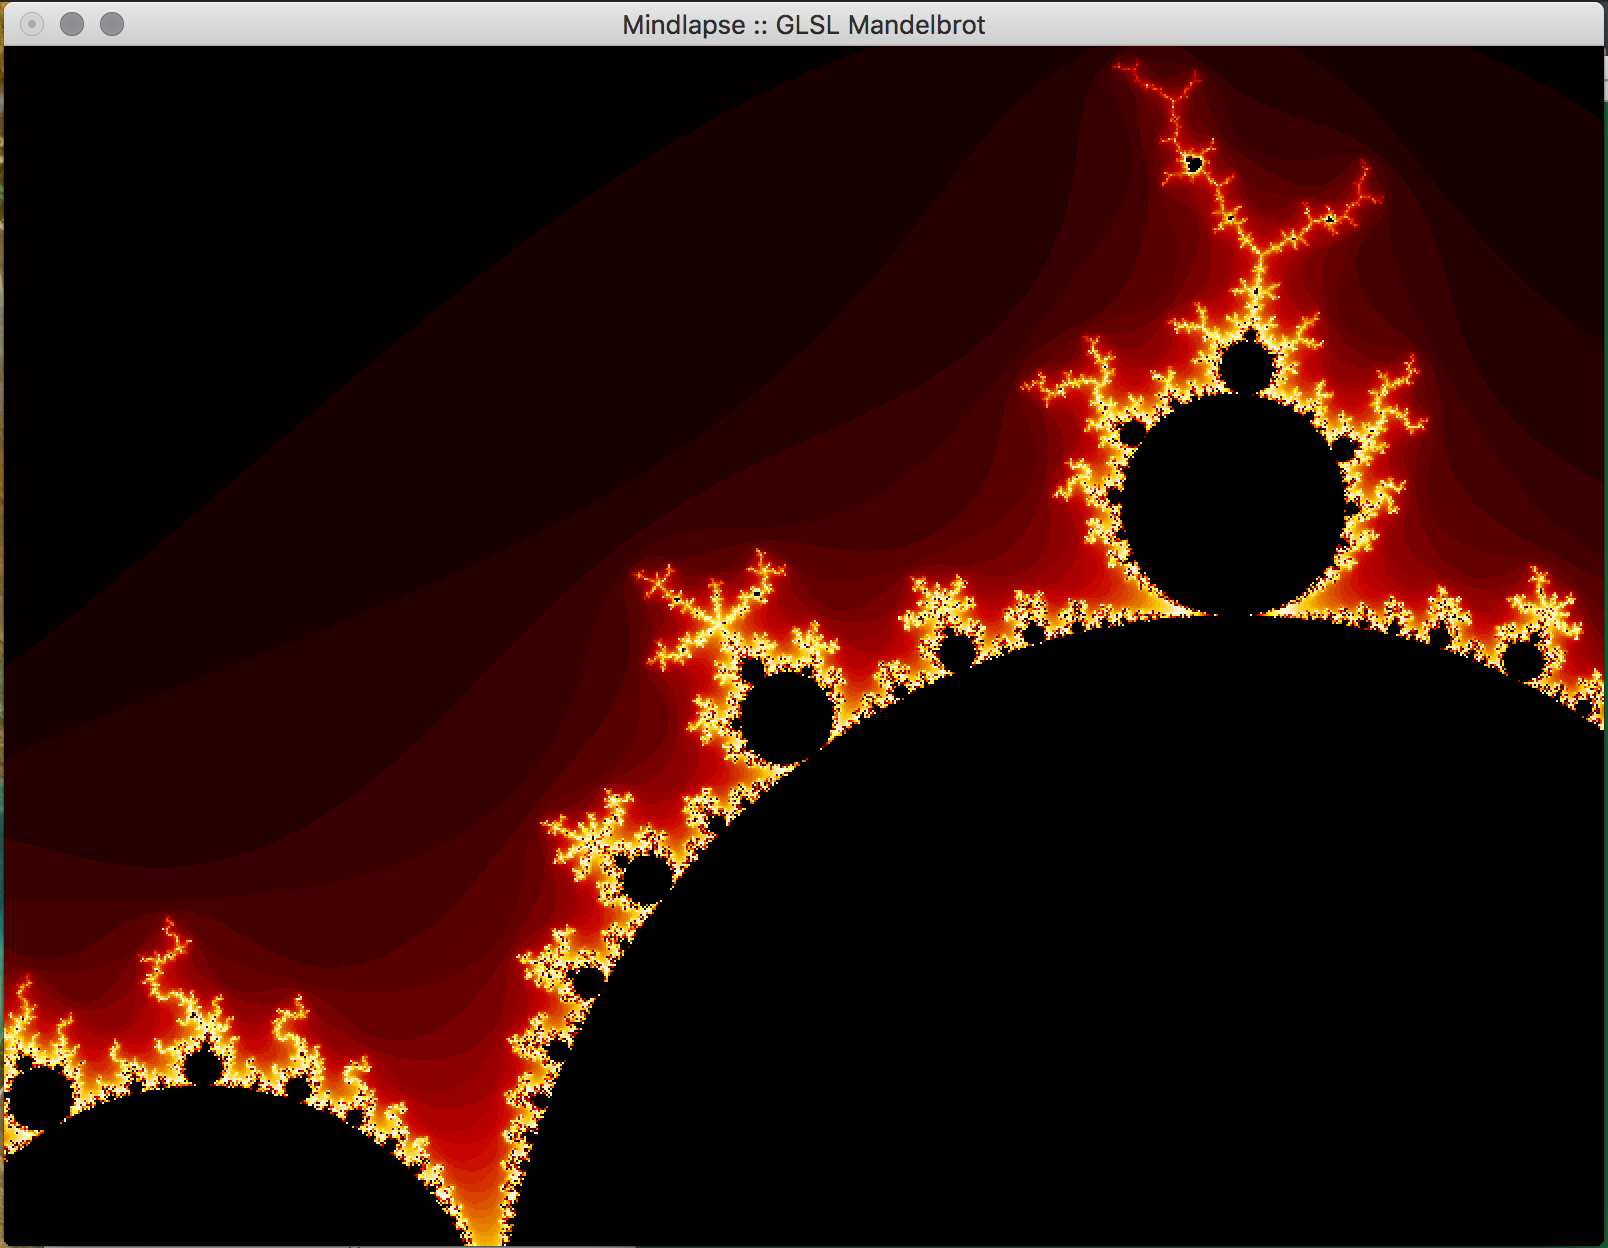
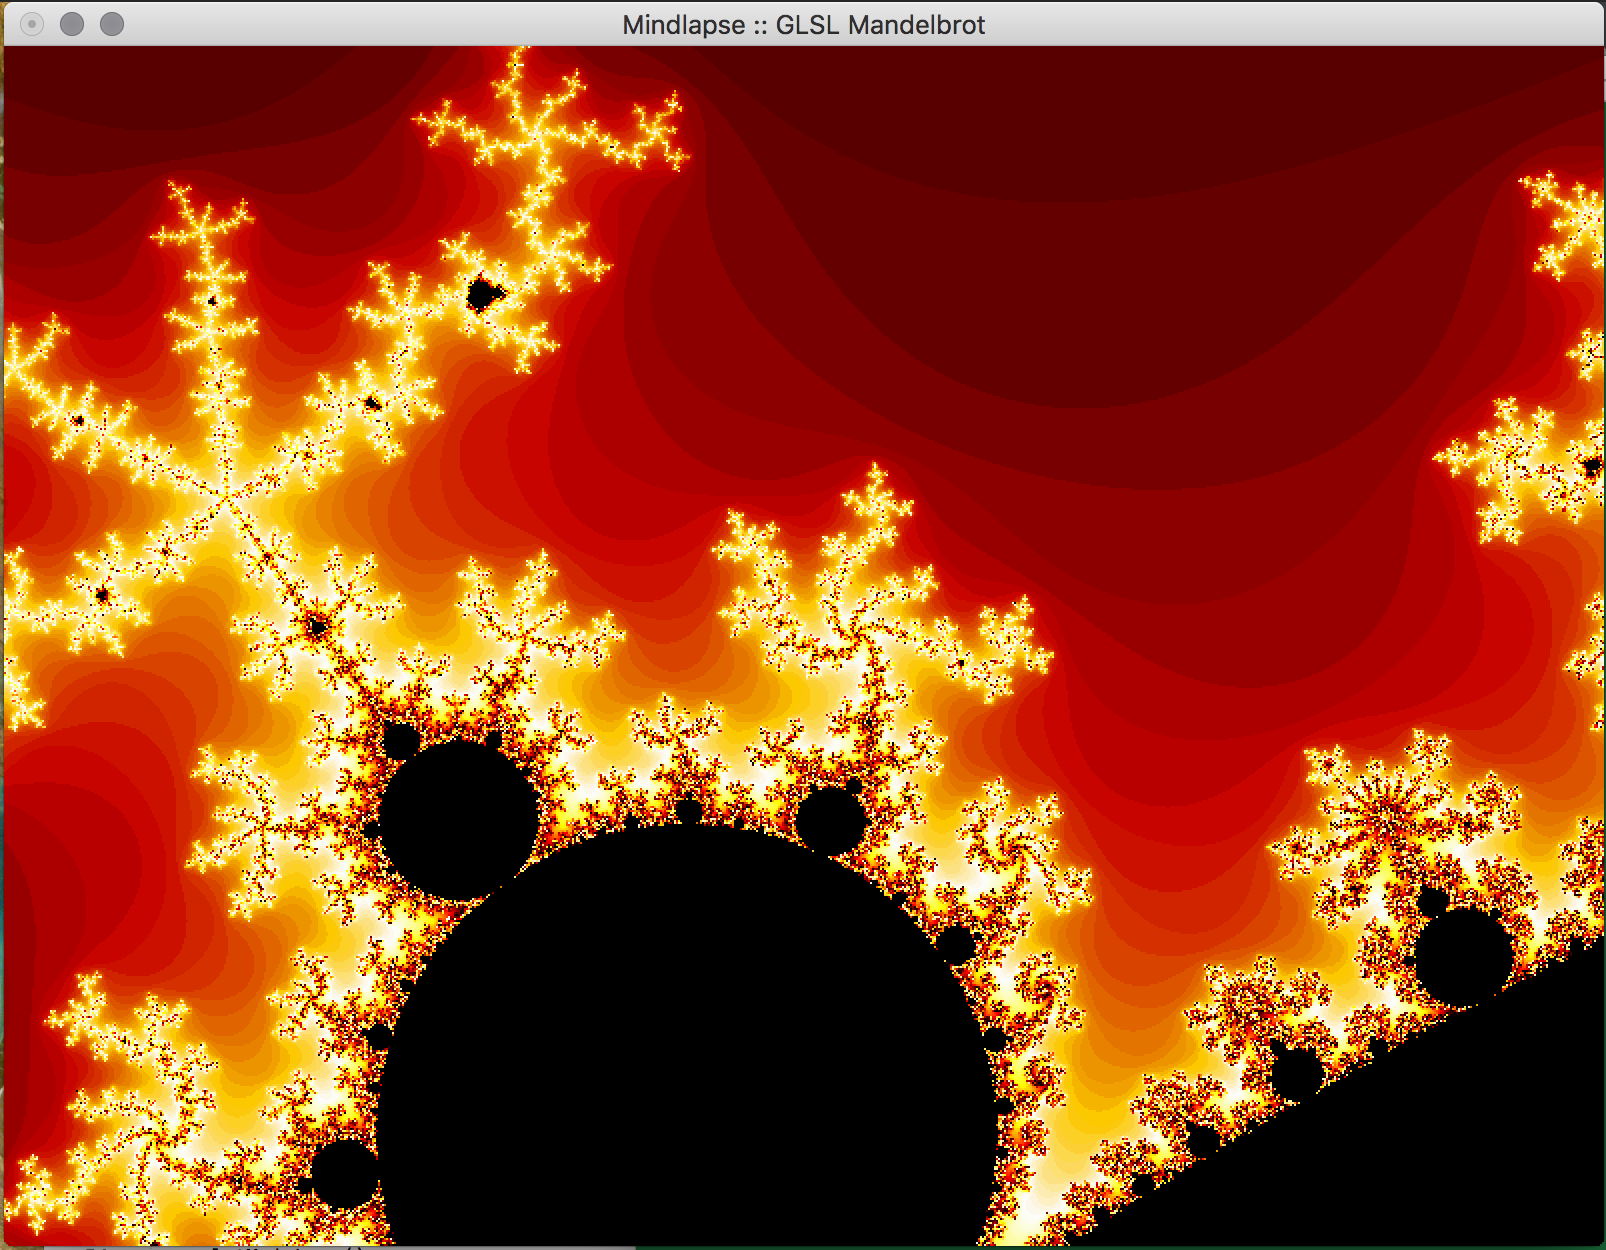
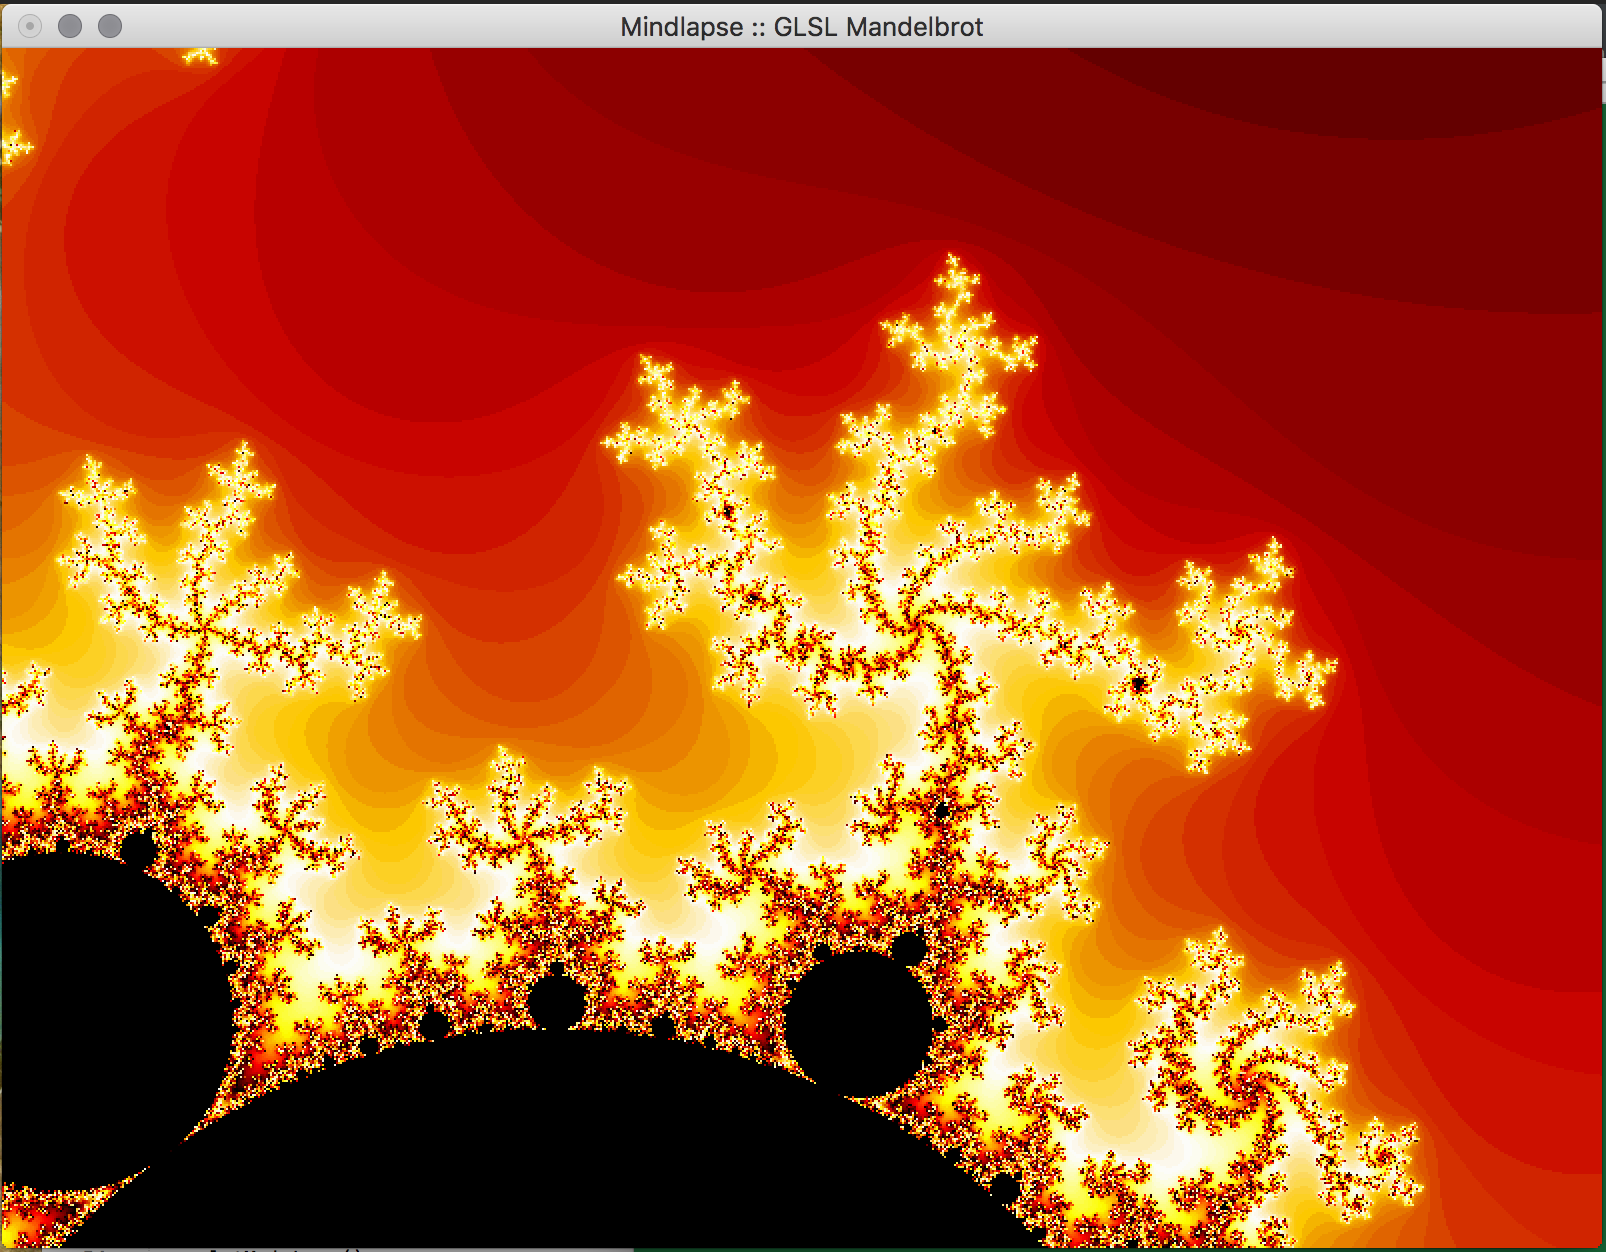
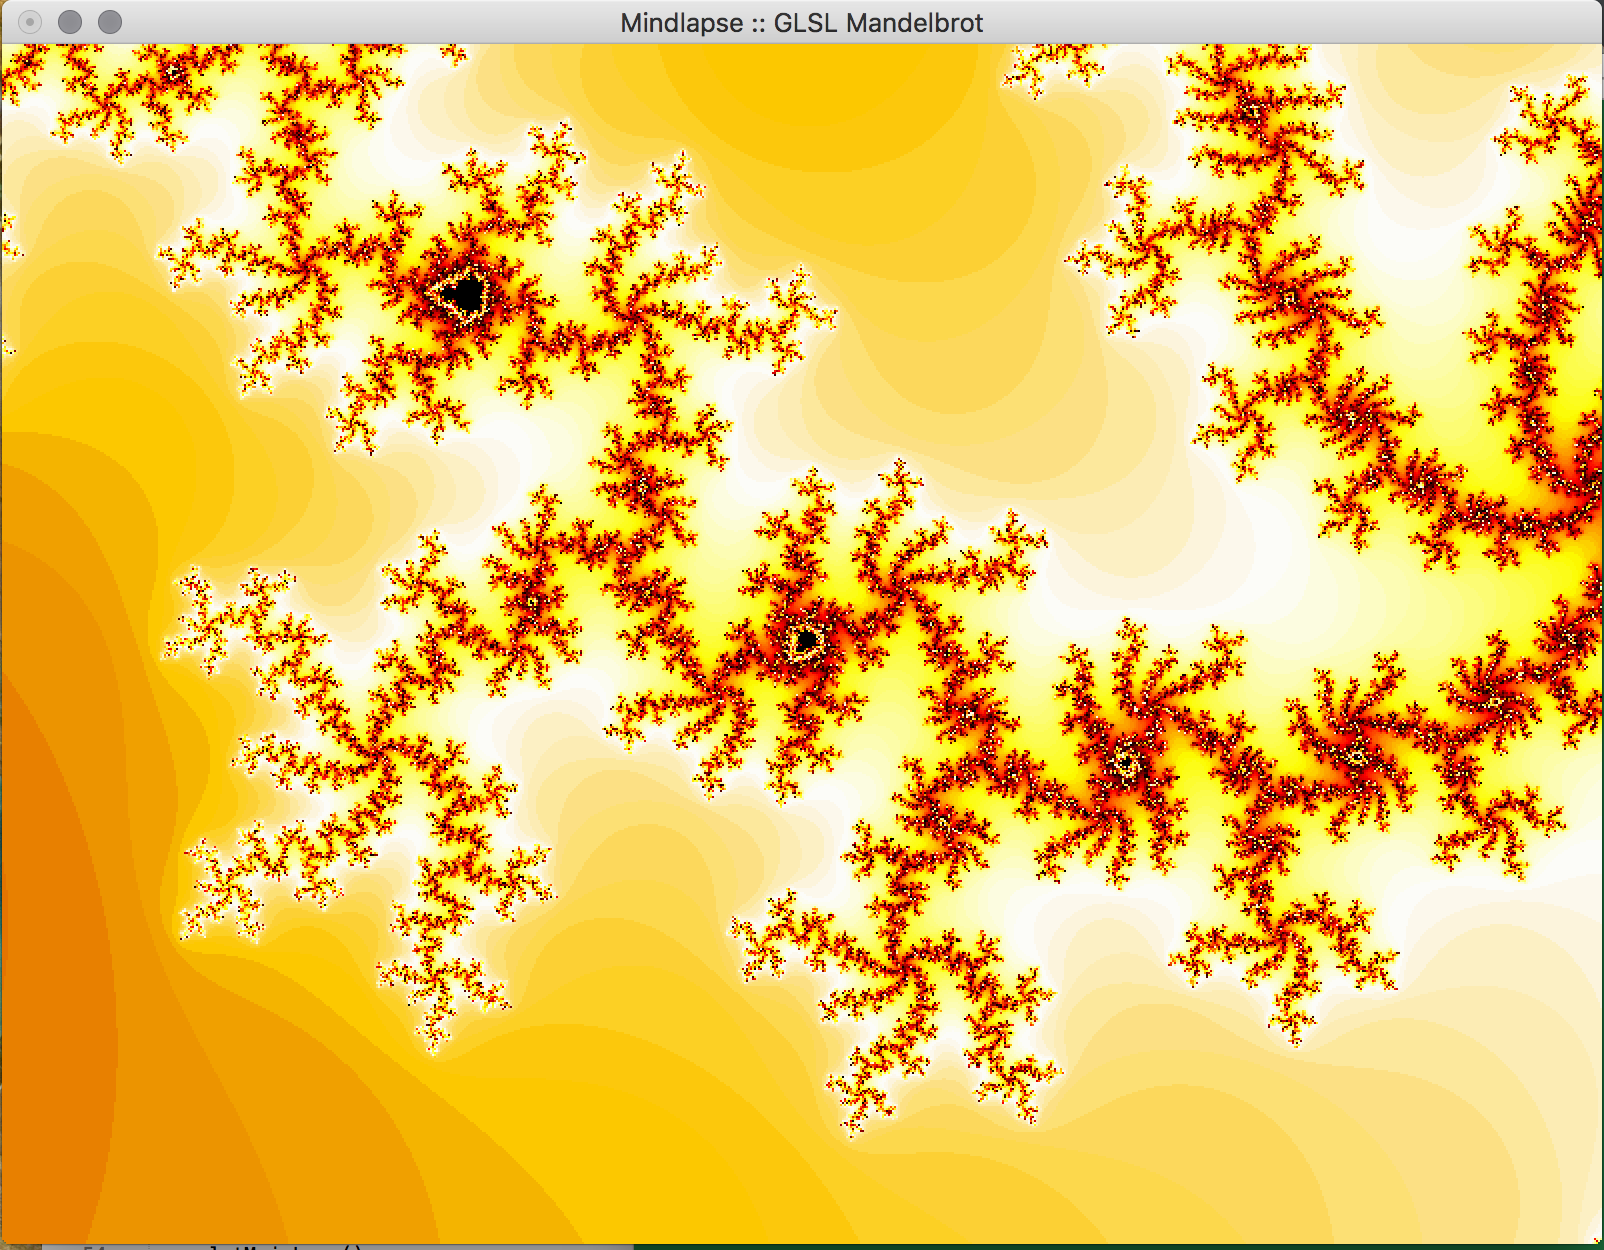
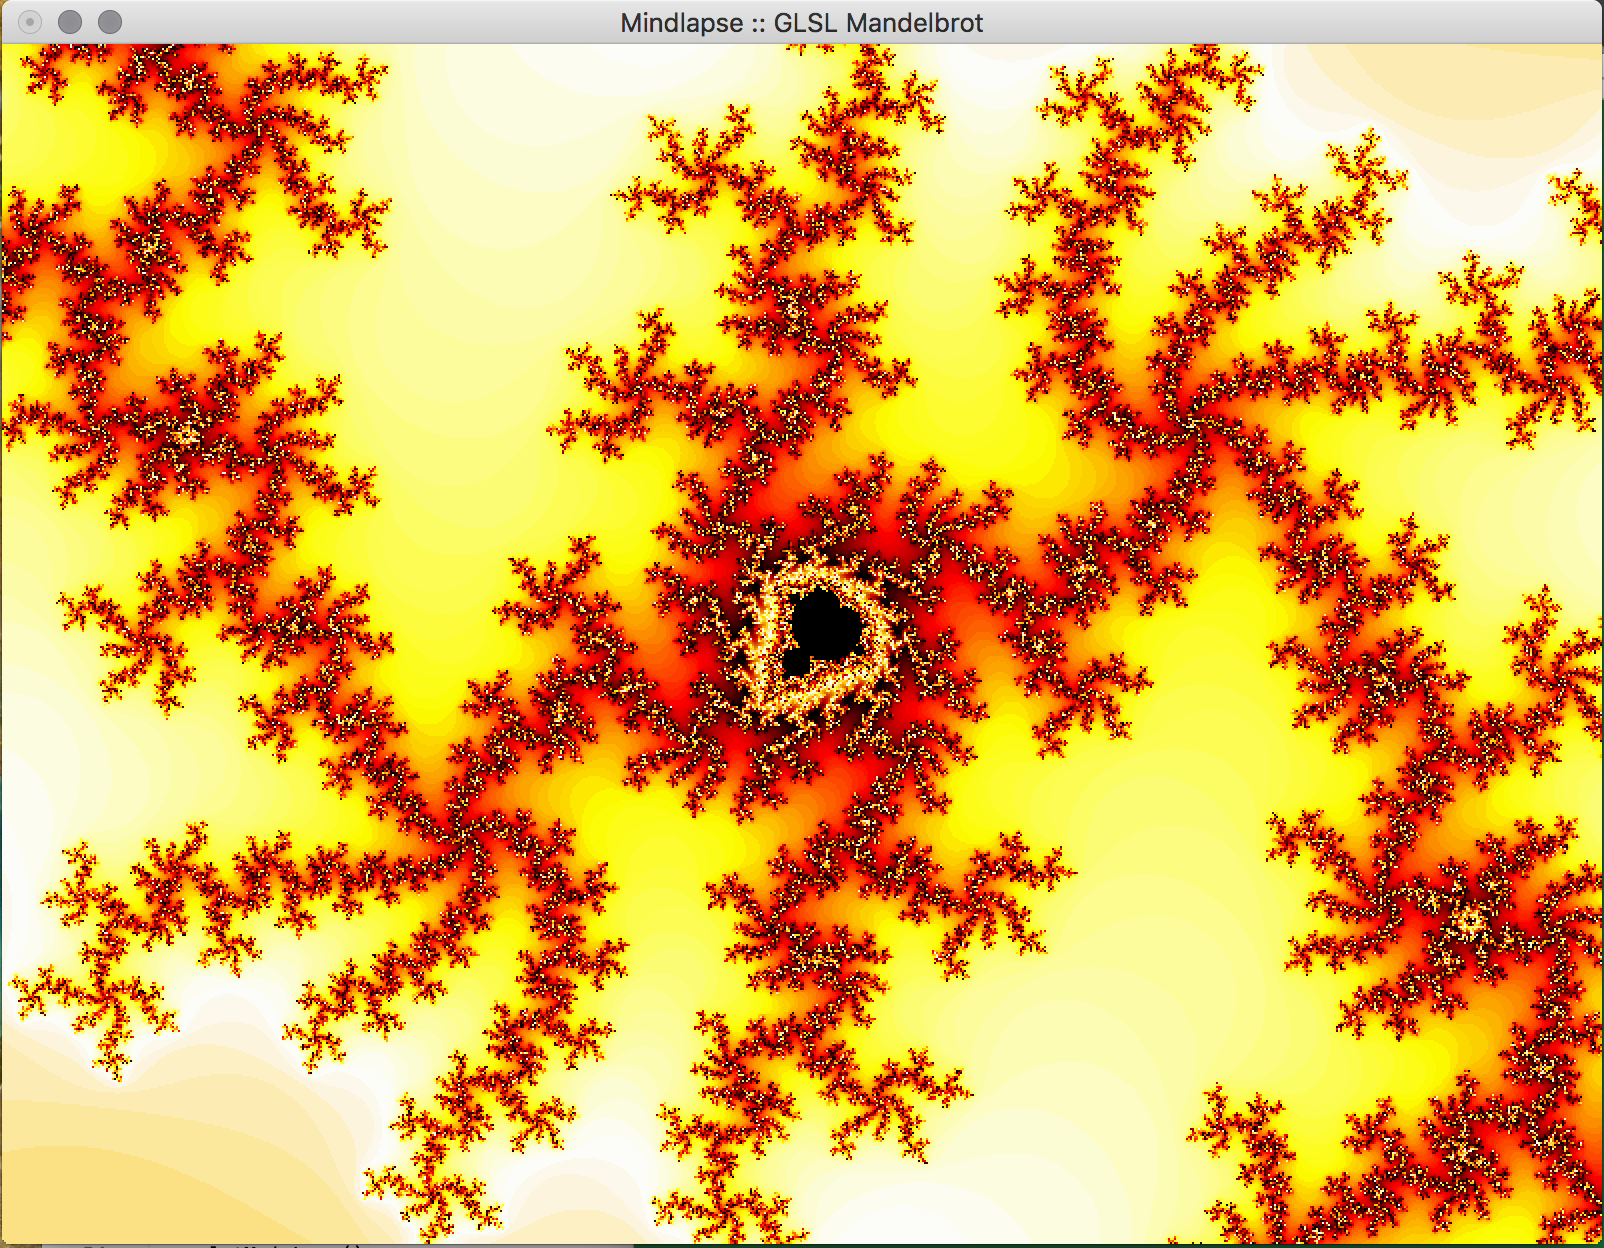
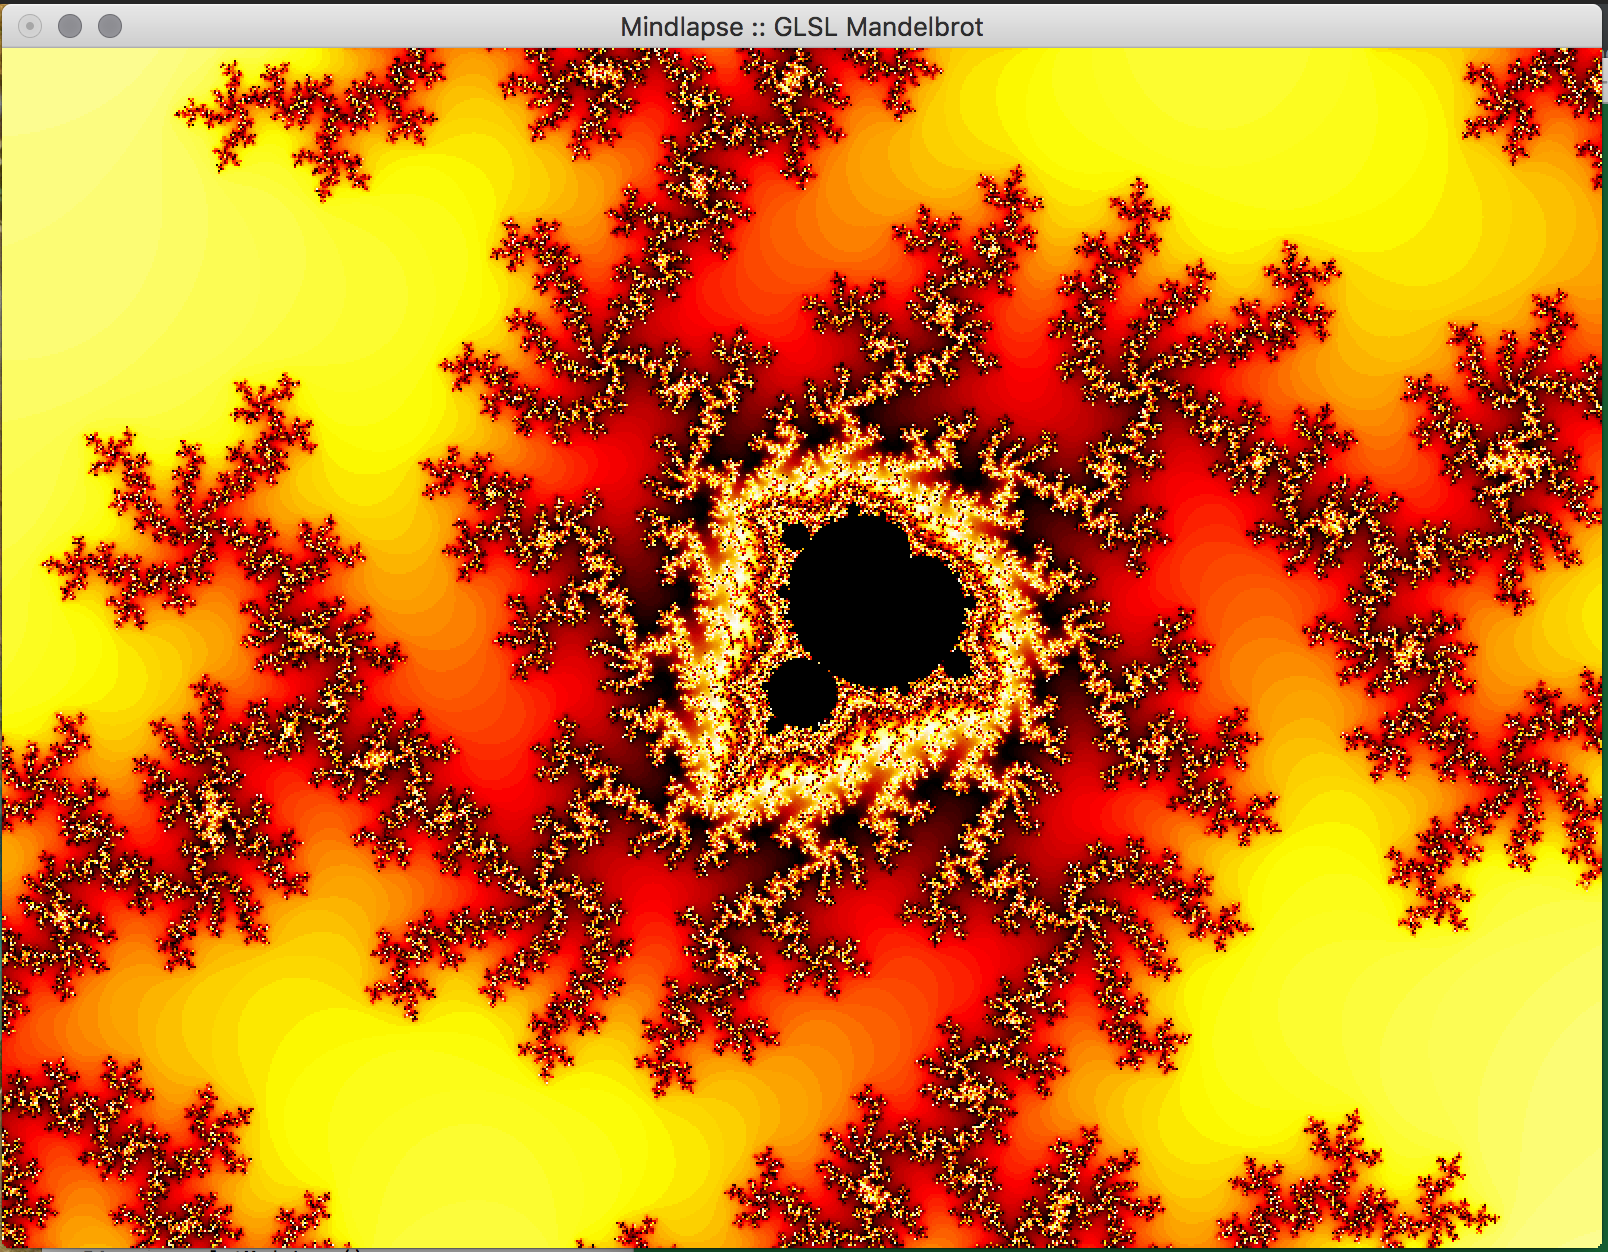
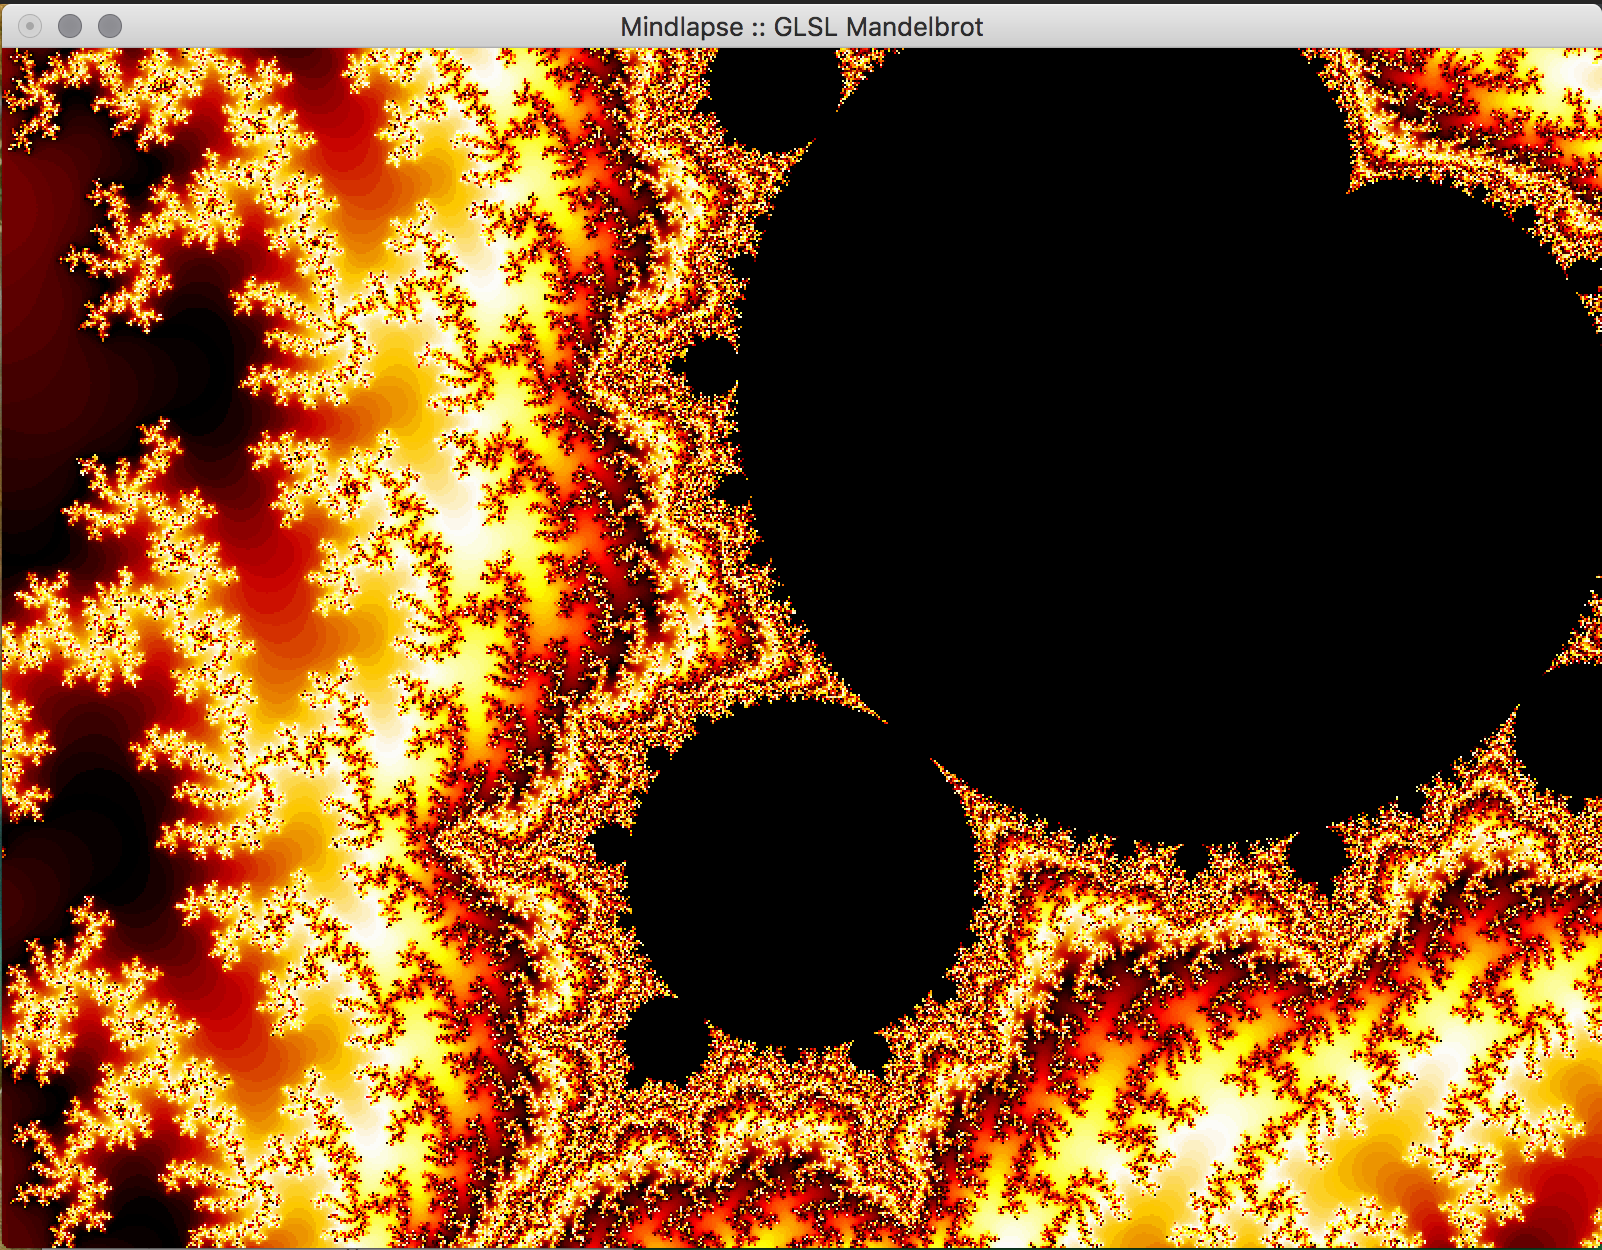
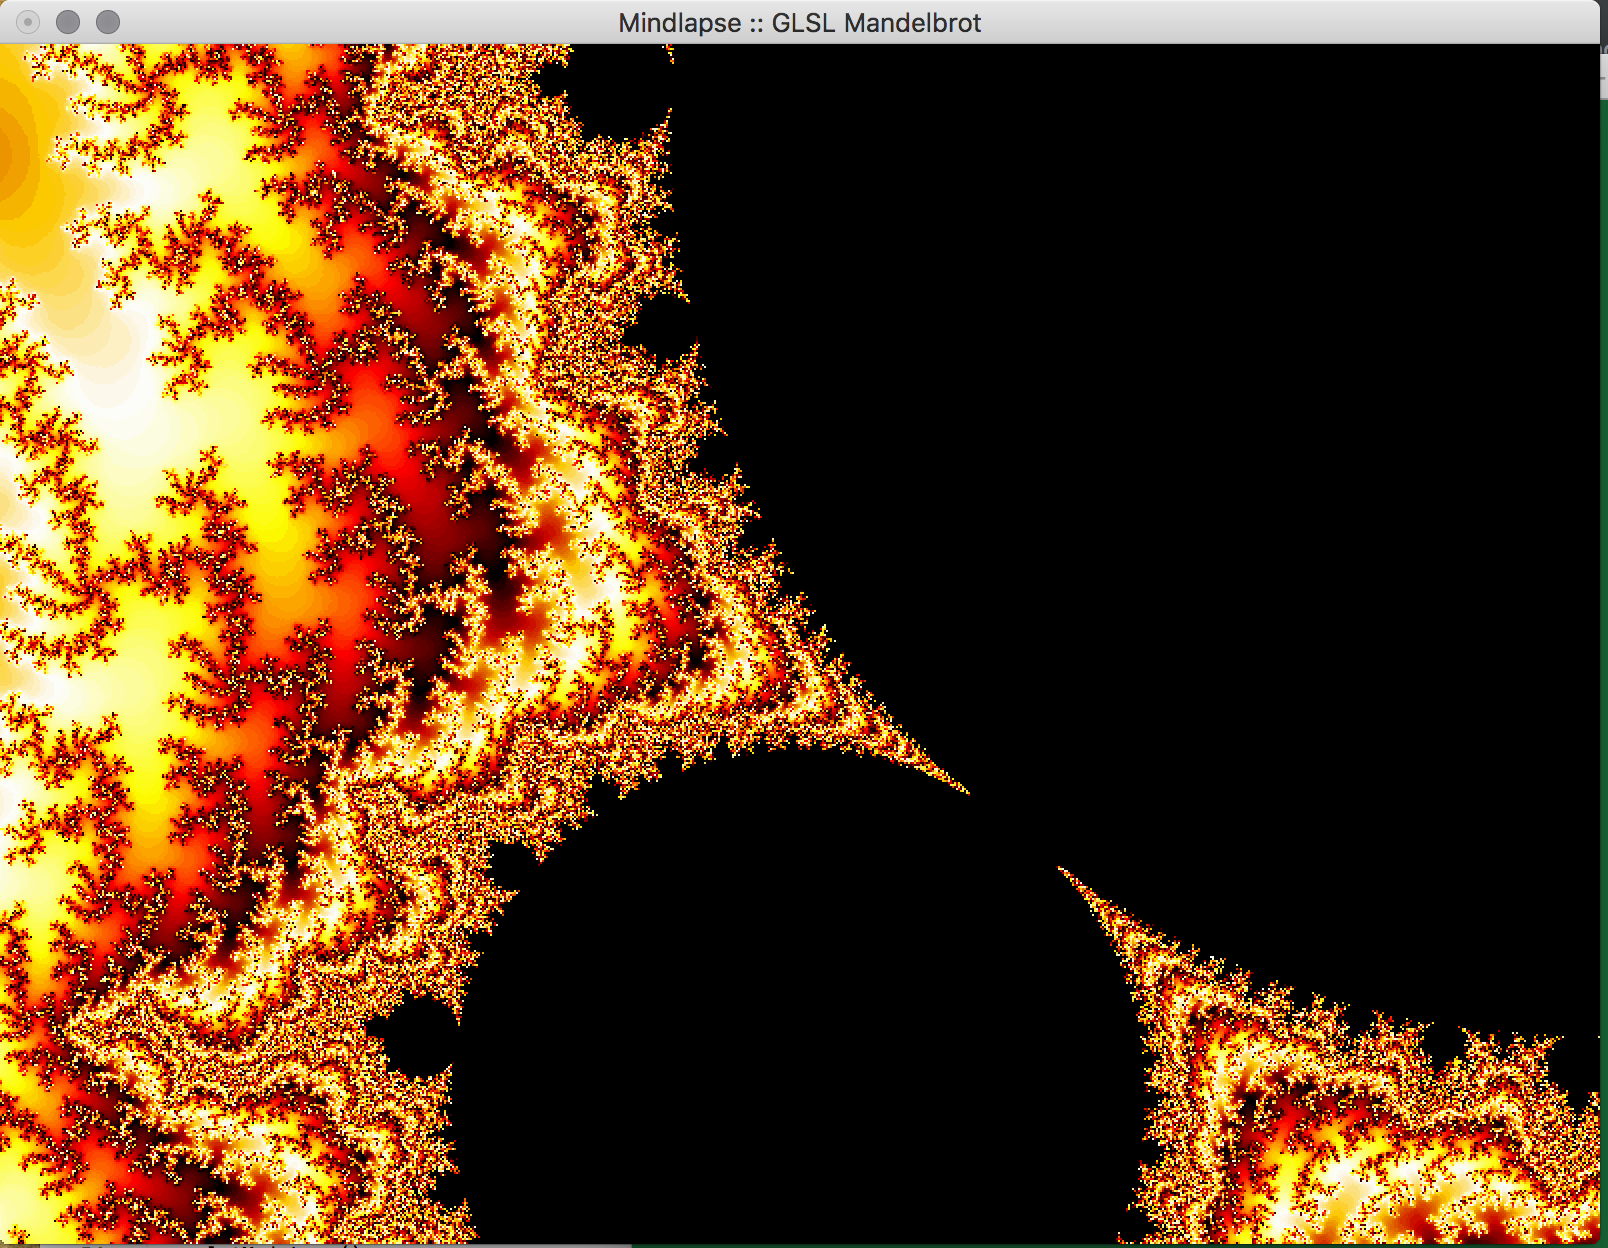
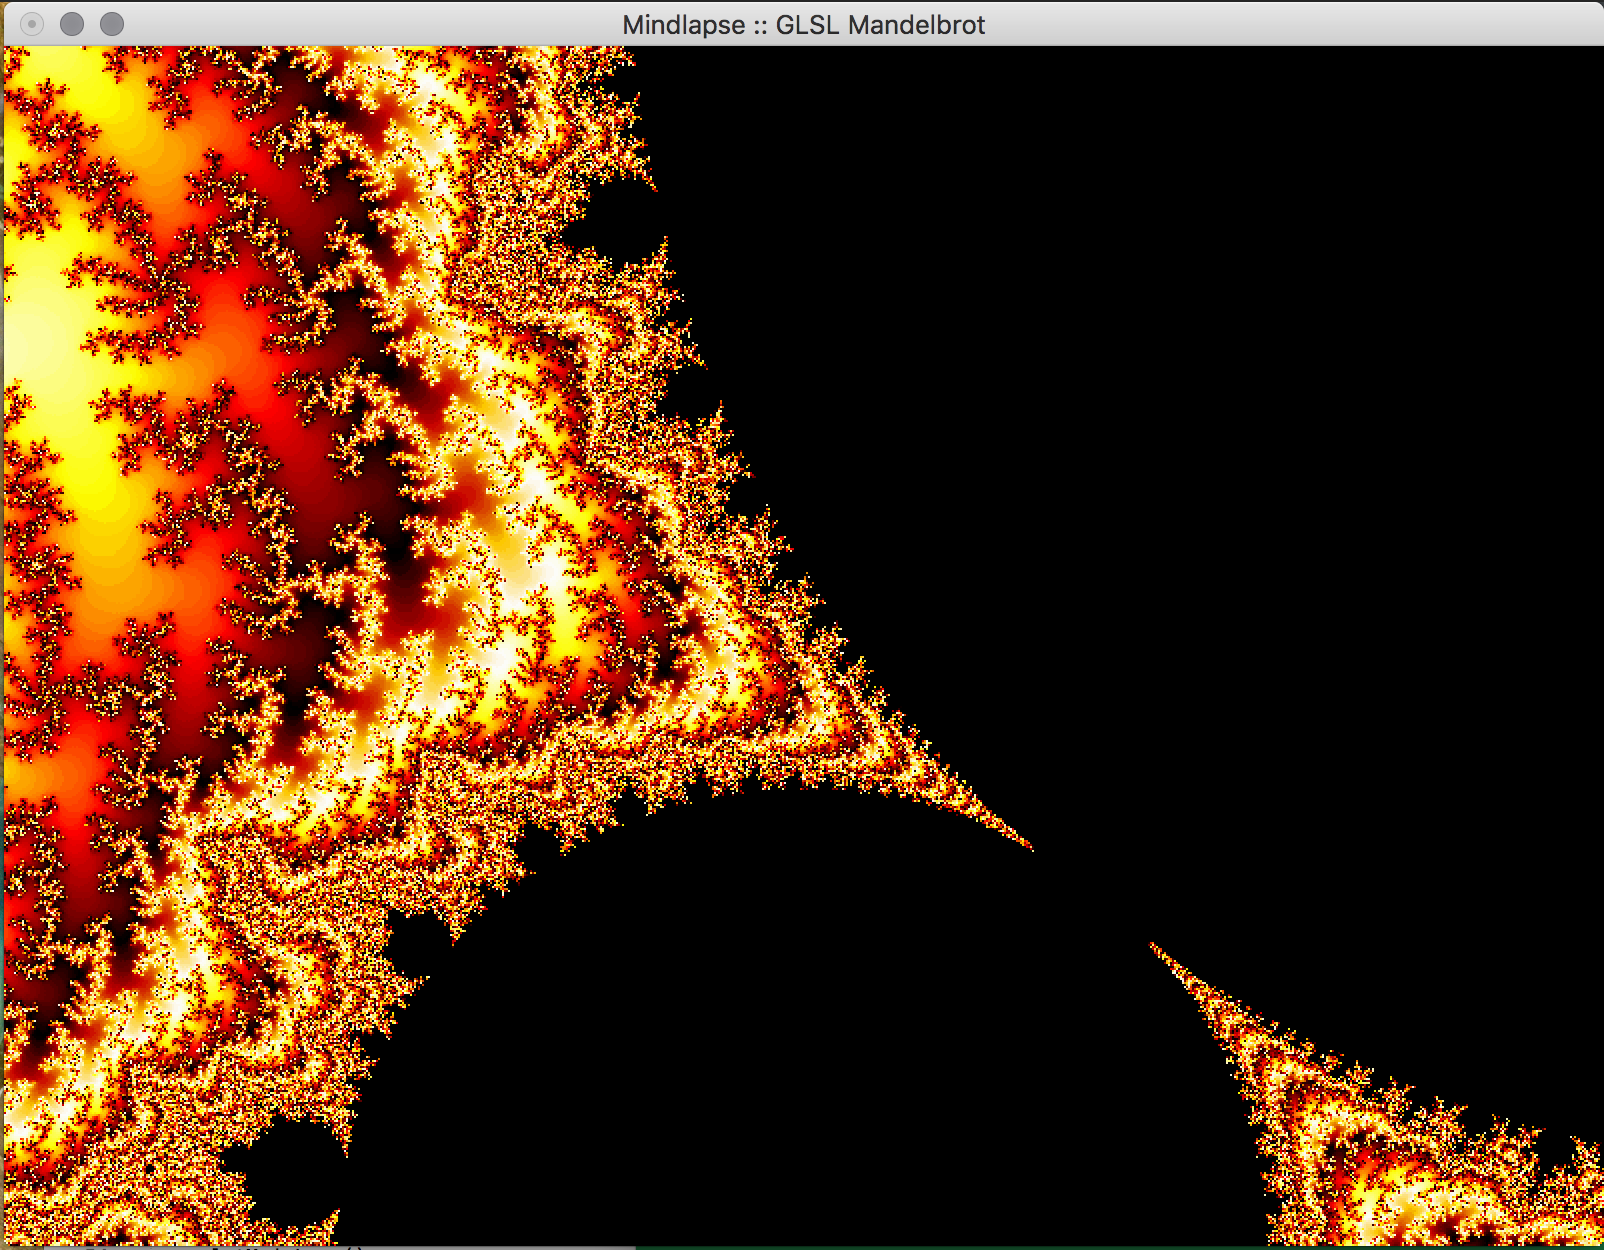
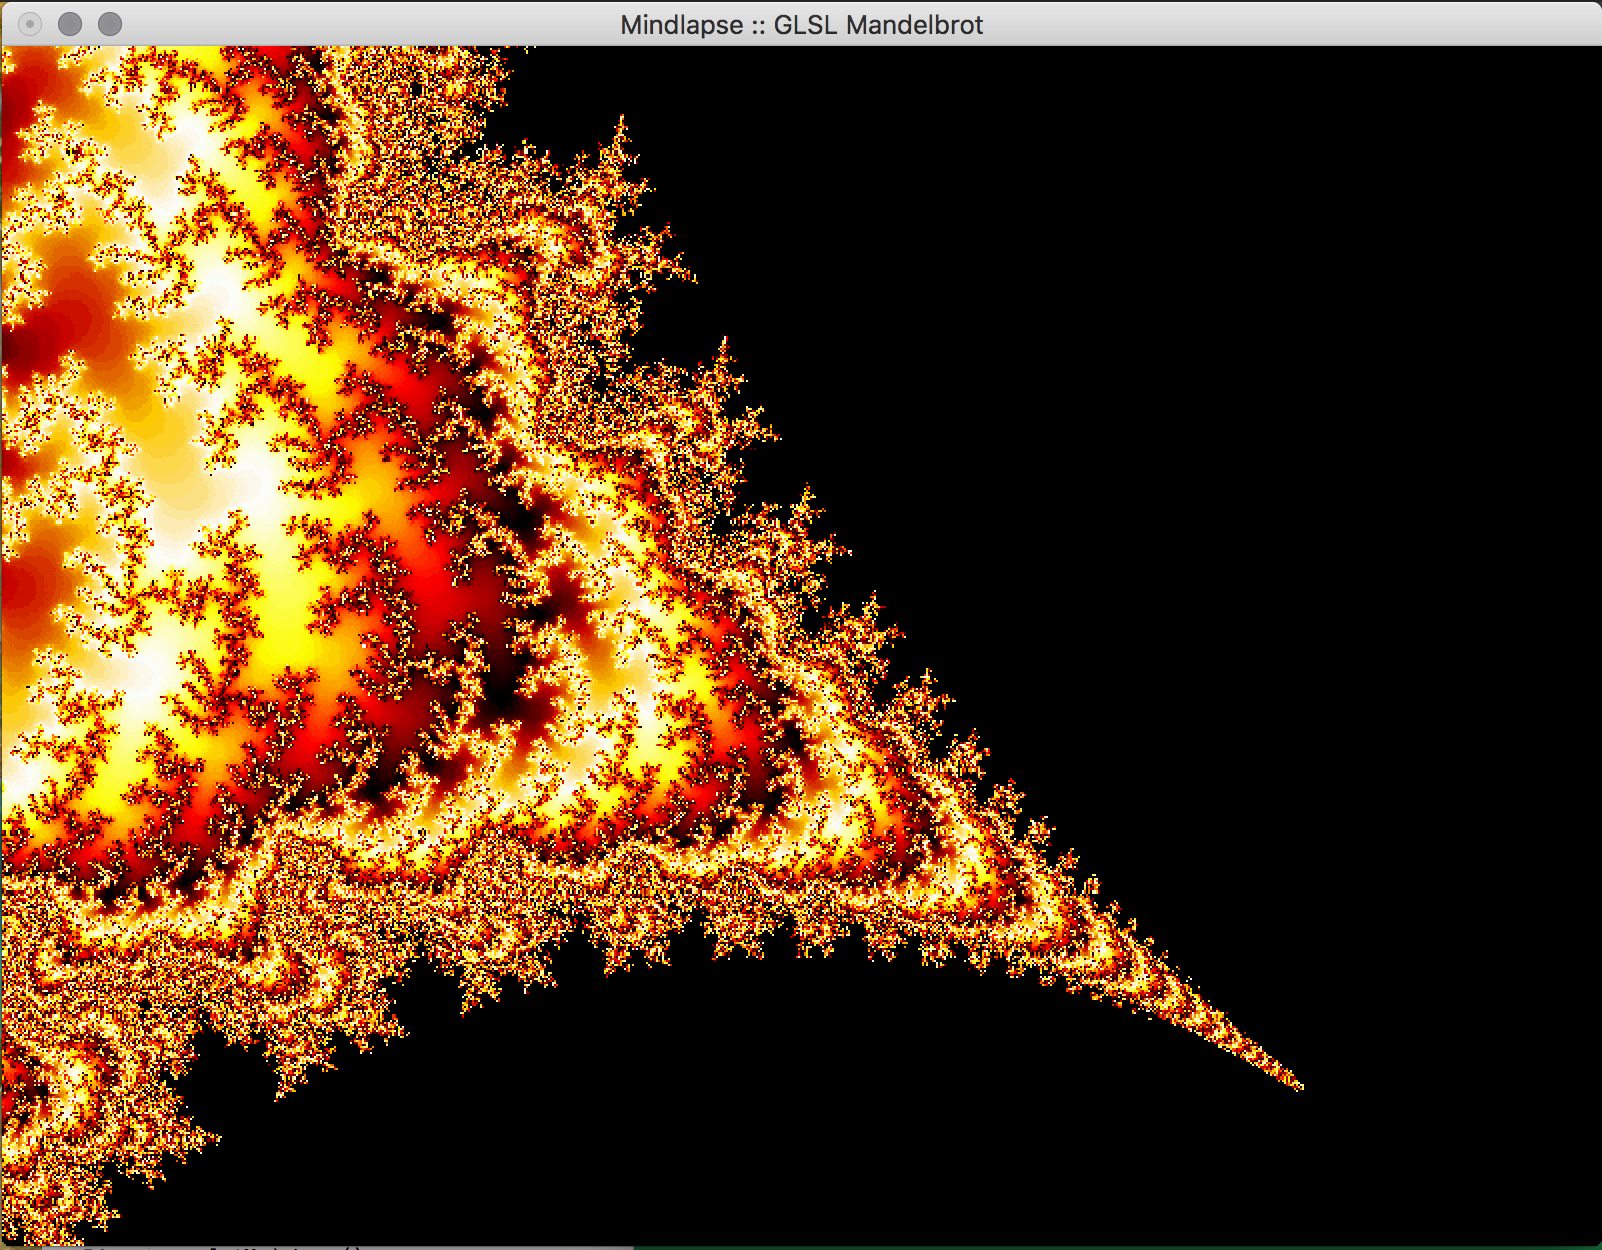
- Key Features & Images: The centerpiece of our project, the visual Mandelbrot Set, is initially displayed in on the real-imaginary axis from -2 to 2 on each axis. Using the mouse, the user can drag the image around in order to center on a piece of the set they would like to magnify. Using the ‘f’ (zoom in) and ‘d’ (zoom out) keys, the user can magnify the image, and if the image becomes too pixelated, they can increase the iterations of the set by using the ‘-’ (fewer) and ‘=’ (more) keys. The GLUT library doesn't support track pad scrolling movement so our implementation of zooming in and out isn't as smooth, but these could possibly be re-implemented in just OpenGL.


- Future Work: In the future, we would like to implement a way to increase the precision of the calculations to allow the user to zoom further into the fractal. This can likely be done by storing the coordinates in the program as doubles, which allows for more bits to specify the exponent used in the calculations using the coordinate. We attempted to do just change all of the floats to doubles, but it appears as if essential OpenGL functions don't support doubles so this would have to be implemented with a custom data structure. Additionally, we would like to allow the user to choose the colors used in the set within the program, and to reduce the bands of color observed in the set. We would also like to implement an animated Julia Set, wherein a user would be able to proceed through the set in adjustable sets, or allow the set to animate itself, or even have the option to view the set in 3 dimensions.
Additional images, a video demo, and an executable can be found HERE (Google Drive link).
Final Project Check-In
OpenGL Mandelbrot Set
Team Members: Katie Manderfeld, Adam Barsness
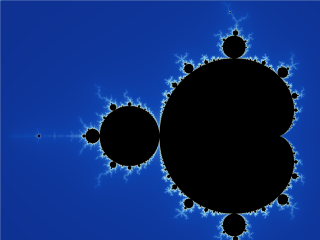
Our ultimate goal is to achieve something like the image below (Source: Simpsons contributor at Wikipedia) with OpenGL where a user can "zoom in" to the Mandelbrot set:
Similar implementations of what we'd like to do are hosted on various sites, two written in JavaScript are particularly interesting: here (just JavaScript) and here (JavaScript and HTML5). Statically generating fractals (just images) are visually pleasing on their own, but it's more interesting if users can interact with the fractals. Ideally a user will be able to zoom with the mousewheel/track pad as if they were scrolling up or down.
Progress
It was possible to find, and more importantly run, an OpenGL implementation in the public domain that renders the Mandelbrot fractal and lets the user zoom in and out centered at (0,0). However, the user can't change where they are zooming, it stays at the center of the image, so the effect of this zoom is fairly limited. To zoom, a user needs to click and hold, and then drag either the mousewheel or trackpad to zoom in or out. This action is fairly cumbersome, and the zooming motion itself is fairly disjointed.
We would also like to increase the quality of the image that is produced, "bands" of color are visible (similar to quantization in image processing), and we'd like to make the transitions between colors more smooth.
It took a while to get to this point because while there are a lot of implementation that exist that simply draw the Mandelbrot set, the code is often not documented well and it was difficult to find something that we could compile and run successfully.
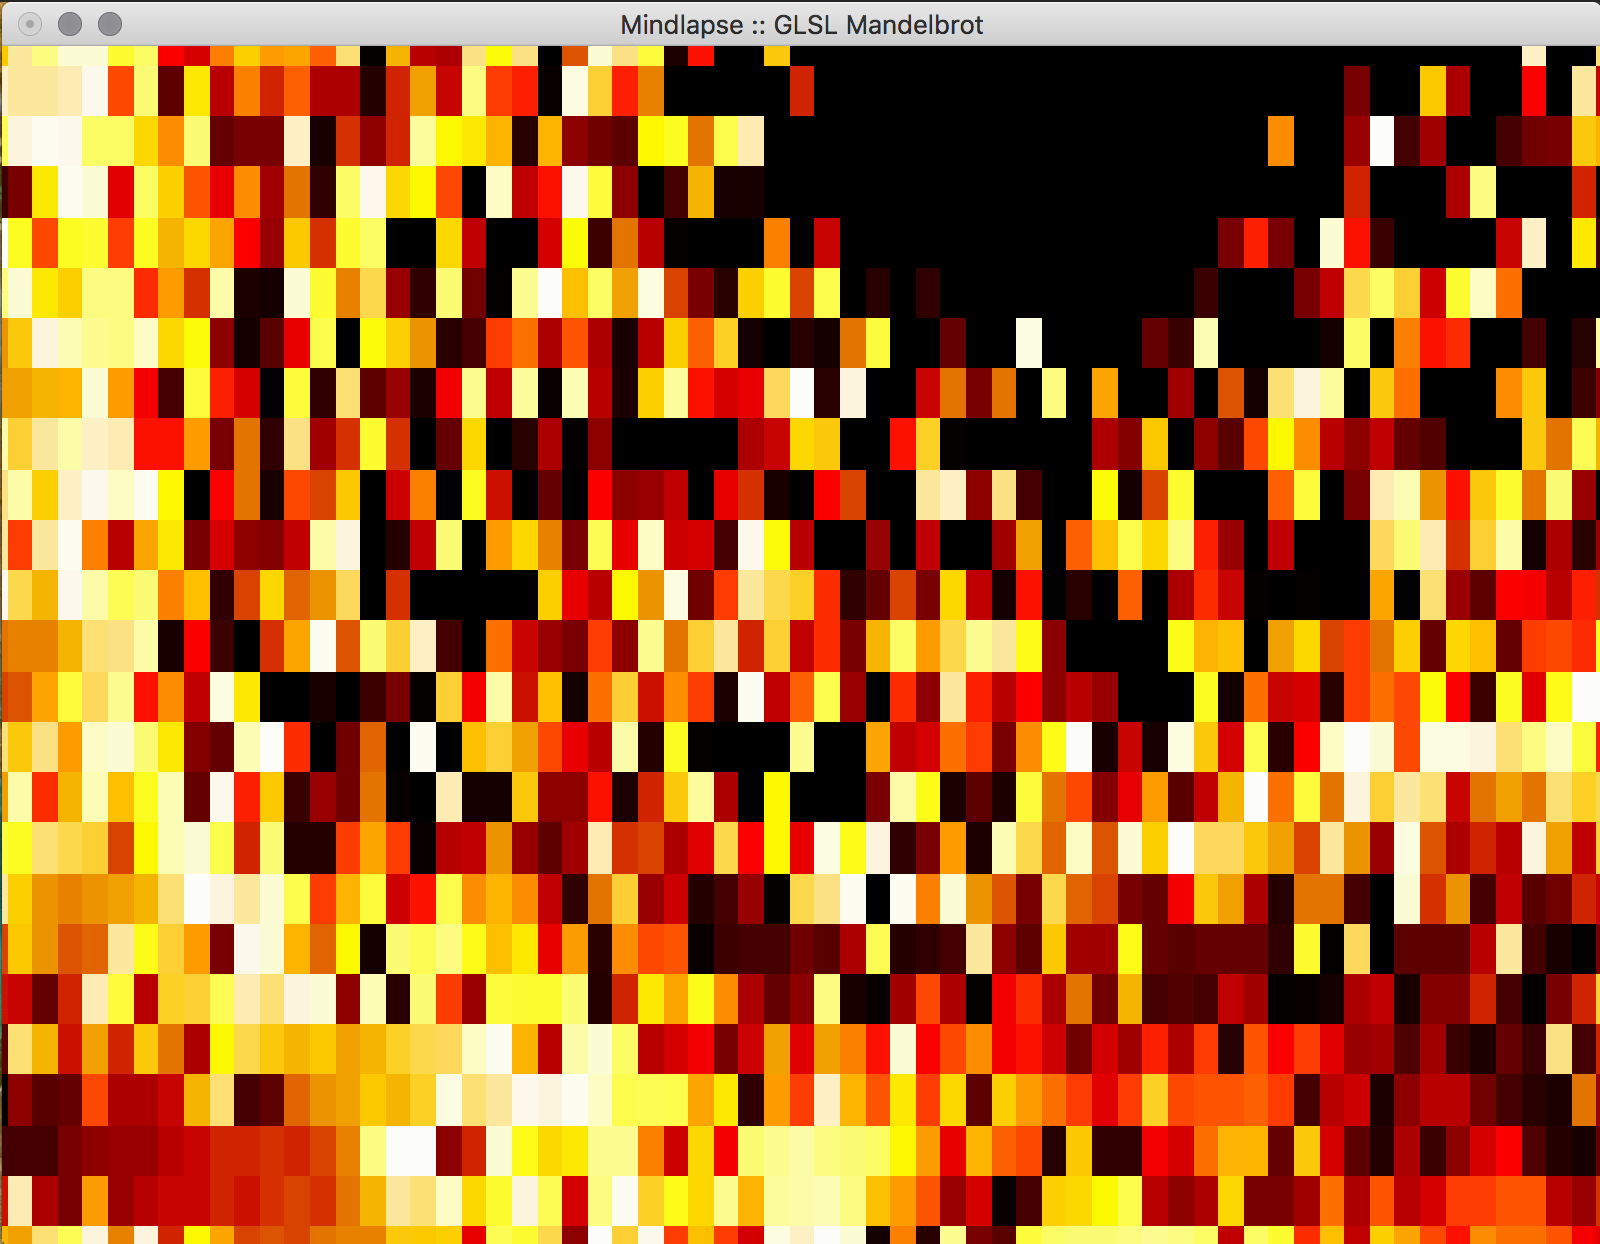
Images of Progress